Figure 2.


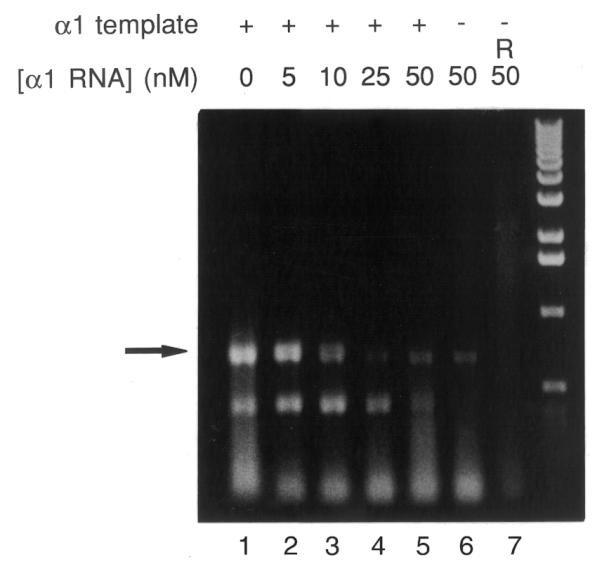
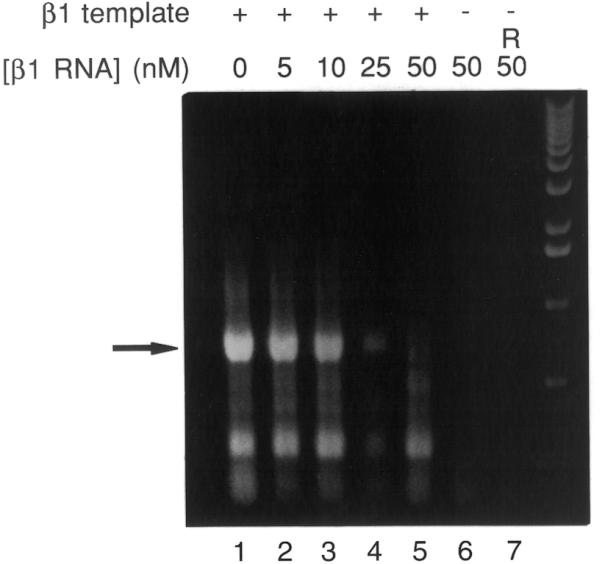
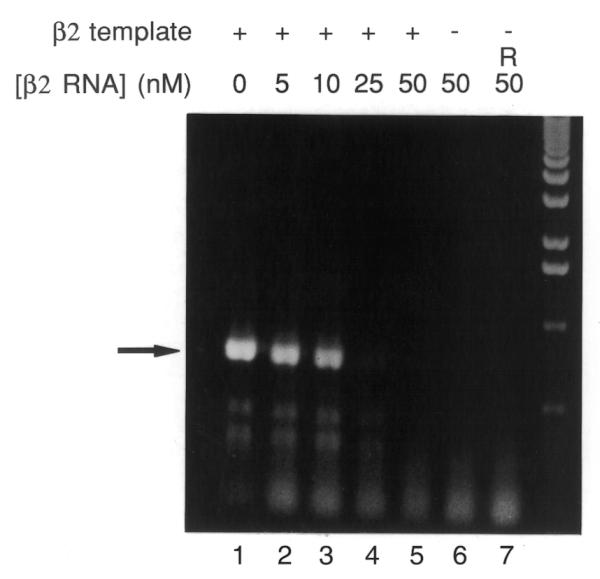
(A) Increasing concentrations of α1 RNA inhibit the amplification of α1 cDNA template. PCR was performed with 0.5 µM sense and 0.5 µM antisense degenerate primers, 0.5 pM α1 cDNA template and 0 (lane 1), 5 (lane 2), 10 (lane 3), 25 (lane 4), 50 nM (lane 5) α1 RNA. PCR was performed with 0.5 µM sense and 0.5 µM antisense degenerate primers without template in the presence of 50 nM α1 RNA (lanes 6 and 7). After PCR the sample (lane 7) was incubated for 15 min with 1 Kunitz U RNase A at 37°C. After electrophoresis, ethidium bromide staining was visualized. The arrow indicates the bands corresponding to the expected 750 bp PCR product. (B) Increasing concentrations of β1 RNA inhibit the amplification of β1 cDNA template. PCR was performed with 0.5 µM sense and 0.5 µM antisense degenerate primers, 50 pM β1 cDNA template and 0 (lane 1), 5 (lane 2), 10 (lane 3), 25 (lane 4), 50 nM (lane 5) β1 RNA. PCR was performed with 0.5 µM sense and 0.5 µM antisense degenerate primers without template in the presence of 50 nM β1 RNA (lanes 6 and 7). After PCR the sample (lane 7) was incubated for 15 min with 1 Kunitz U RNase A at 37°C. The arrow indicates the bands corresponding to the expected 750 bp PCR product. (C) Increasing concentrations of β2 RNA inhibit the amplification of β2 cDNA template. PCR was performed with 0.5 µM sense and 0.5 µM antisense degenerate primers, 0.5 pM β2 cDNA template and 0 (lane 1), 5 (lane 2), 10 (lane 3), 25 (lane 4), 50 nM (lane 5) β2 RNA. PCR was performed with 0.5 µM sense and 0.5 µM antisense degenerate primers without template in the presence of 50 nM β2 RNA (lanes 6 and 7). After PCR the sample (lane 7) was incubated for 15 min with 1 Kunitz U RNase A at 37°C. The arrow indicates the bands corresponding to the expected 750 bp PCR product.
