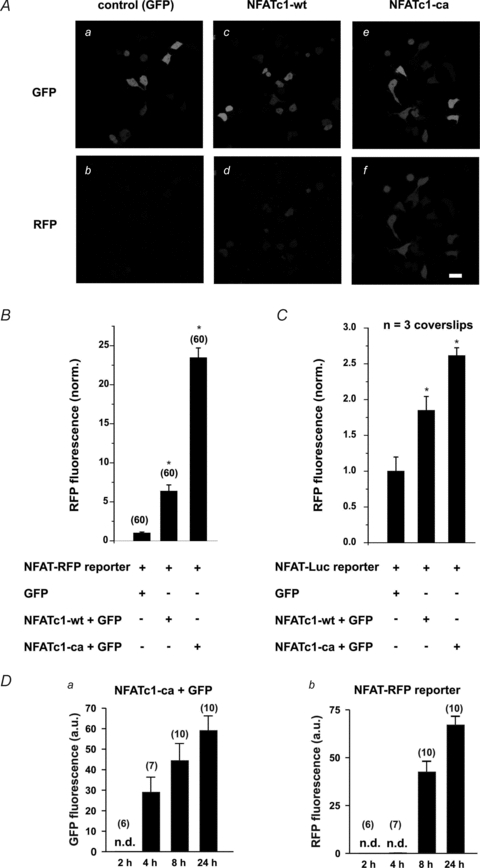
Figure 1. Transcriptional activity of NFATc1 in HEK 293 cells.

A, expression of NFATc1 wild-type (NFATc1-wt) resulted in detectable RFP expression (Ad) compared to control cells (GFP, Ab). This effect was further enhanced in the presence of constitutively active NFATc1 (NFATc1-ca) (Af). a, c and e, corresponding GFP images (transfection control). Scale bars: 30 μm. B, summary data indicating an increase in RFP fluorescence corresponding to enhanced NFATc1 activity (NFATc1-ca > NFATc1-wt > GFP-control). C, summary data of a luciferase assay (NFAT-Luc) under the same experimental conditions (3 coverslips per condition). Data were normalized to the average RFP fluorescence measured in cells expressing only GFP and NFAT-RFP (B) or NFAT-Luc (C). D, time dependence of transcriptional activity reported by NFAT-RFP in response to stimulus duration. In cells co-expressing NFATc1-ca and NFAT-RFP, GFP (a measure of NFATc1-ca expression) was detected after 4 h and further increased with time (Da). Db, in GFP-positive cells, RFP was detected after 8 h, further increasing over 24 h. Note that the expression of NFATc1-ca precedes the NFAT-RFP response by 4 h. Times indicated are hours after transfections. Numbers in parentheses indicate the number of individual cells tested. n.d.: not detectable.
