
Figure 3. MuSK autoantibodies reduced postsynaptic MuSK staining.
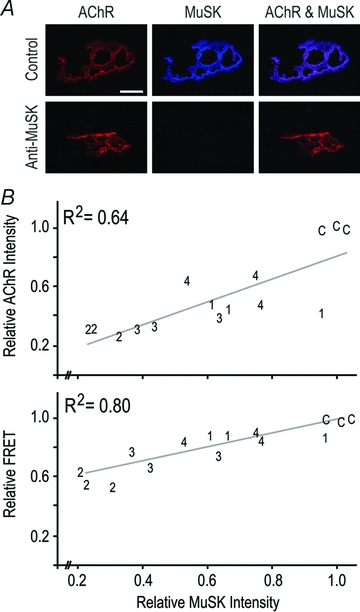
Mice were injected with human IgG as above for 14 days. A, extended focus images show double labelling of endplates for AChR (Alexa488–α-bungarotoxin) and MuSK (sheep anti-MuSK). In the case of mice injected with MuSK2 IgG the brightness and contrast was increased for reproduction. Scale bar is 10 μm. B, scatter plots depict postsynaptic MuSK staining intensity versus AChR staining intensity (upper plot), and MuSK intensity versus the efficiency of AChR–AChR FRET (lower plot). Each number on the plot is a data point (the average value for endplates from a single mouse). Numbers refer to the patient from whom the IgG was derived (C, control IgG). The R2 value shown in each panel is the square of the correlation coefficient for the least-squares line of best fit.