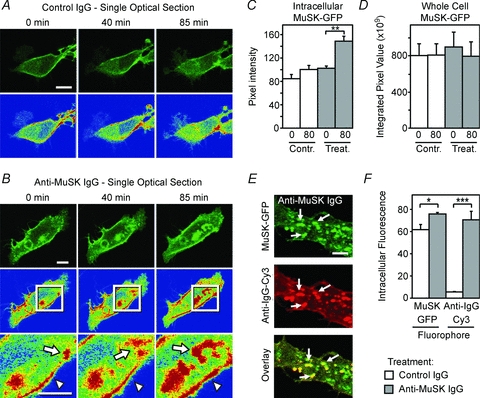
Figure 8. MuSK autoantibodies cause internalization of MuSK.

A, time-lapse imaging of MuSK–EGFP in a mouse C2 myoblast. Optical sections are shown through the core of a single myoblast 0, 40 and 85 min after adding control IgG (2 mg ml−1) to the culture medium. Pseudo-colour images (lower panels) revealed little net change in the subcellular distribution of MuSK over 85 min (red represents the most intense staining). B, time-lapse imaging of MuSK–EGFP in a single myoblast 0, 40 and 85 min after adding MuSK2 IgG to the culture medium. MuSK–EGFP accumulated in large intracellular compartments via a series of endocytic events (arrows in inset). C, increase in the average intensity of MuSK–EGFP fluorescence deep in the cytoplasm following the addition of MuSK2 IgG at time zero. D, maximum-projection images revealed no significant change in total cellular MuSK–EGFP over 80 min with either MuSK2 or control IgG. E, double labelling reveals human IgG (anti-IgG-Cy3) co-internalized with MuSK–EGFP (arrows). F, increased intracellular fluorescence intensity reflecting net internalization of both MuSK–EGFP and human IgG (anti-IgG-Cy3) in MuSK2 IgG-treated cells, compared with cells exposed to control human IgG. Data in panels C and D represent n= 3 cells imaged from 3 separate cultures. Data in panel F represent n= 3 independent culture experiments. Scale bar is 10 μm for panels A and B and 5 μm for panel E.
