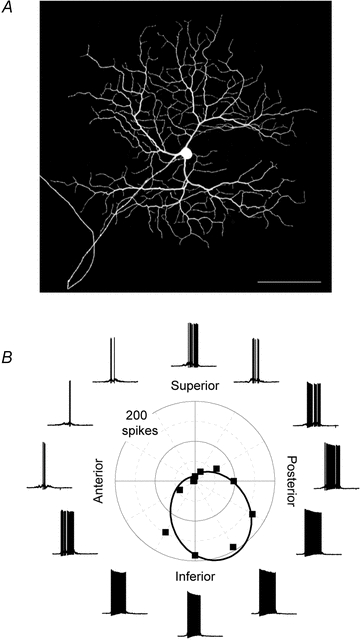
Figure 1. Directional tuning of DSGCs.

A, dendritic morphology of an ON DSGC revealed by dye filling with Neurobiotin; the terminal dendrites often branch at right angles from the parent dendrite, producing a space-filling lattice. Scale bar = 100 μm. B, current-clamp recordings from an ON DSGC in response to a light bar moved in 12 directions through the receptive field; the polar plot shows the mean number of spikes for each direction of image motion (squares), together with a von Mises fit of the data (continuous line).
