
Figure 7. Temporal response properties of DSGCs to moving gratings and stationary flickering spots.
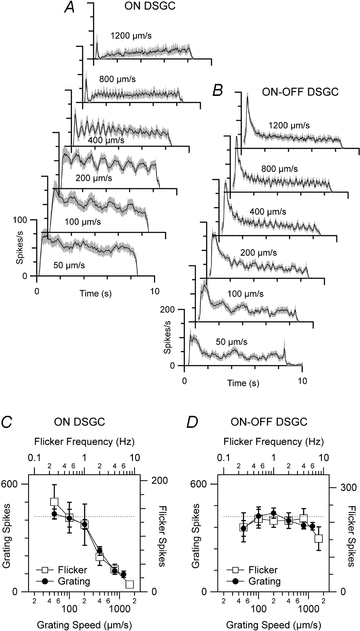
A and B, mean spike-frequency histograms (±s.e.m.) for ON DSGCs (n= 11) and ON–OFF DSGCs (n= 15) in response to gratings moved in the preferred direction at different velocities. C and D, spike counts in response to moving gratings (filled circles) and stationary flickering spots (open squares) matched for temporal frequency; the spike counts are vertically scaled to account for differences in the absolute number of spikes generated by moving and stationary temporal stimuli.