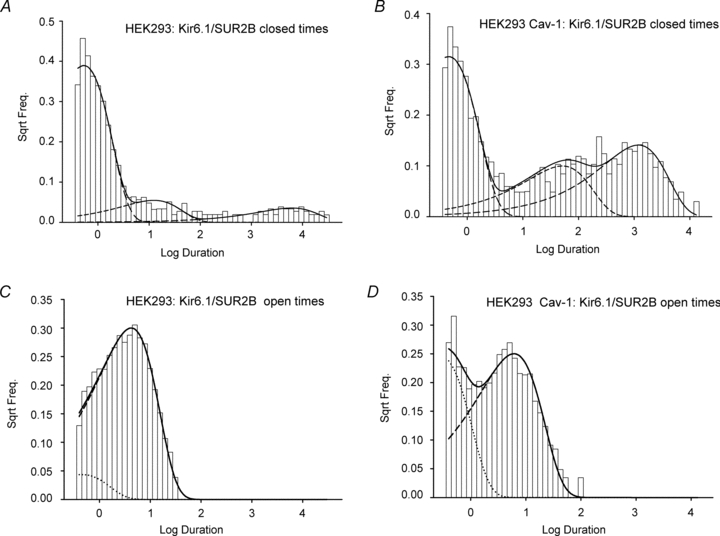
Figure 5. Caveolin induces changes in state occupancy.

Open and closed dwell time distributions measured in cell-attached patch mode at −40 mV for caveolin-null HEK293 cells (A and C) or HEK293 caveolin-1 cells (B and D) expressing Kir6.1/SUR2B. Continuous lines show the probability distribution function directly computed from the schemas illustrated in Fig. 4. Dashed lines represent the individual component exponentials (2 open, 3 closed), each computed from the schema's Q matrix inverse eigenvalues.
