
Figure 1. Effects of heat-stress on Frank–Starling curves by expressing the relation between CVP (upper panel) and PCWP (lower panel) to SV during normothermia, heat stress, and heat stress plus volume infusion.
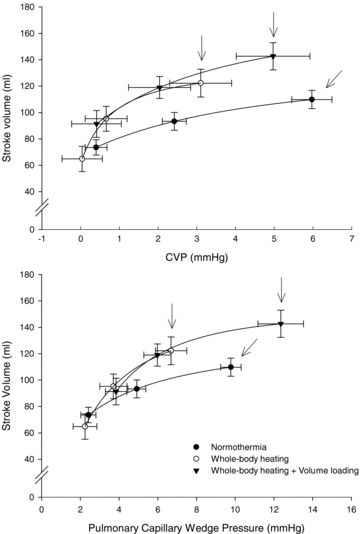
Data were obtained prior to LBNP and subsequent 15 and 30 mmHg LBNP for each of the indicated conditions. The arrows indicate pre-LBNP responses (i.e. operating point) for each thermal condition. The operating point is the prevailing PCWP, CVP and SV prior to the onset of LBNP. Lines represent fitted approximations.