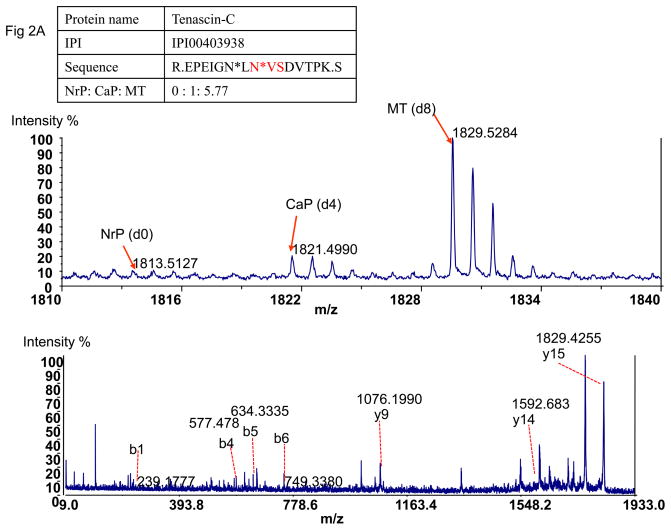
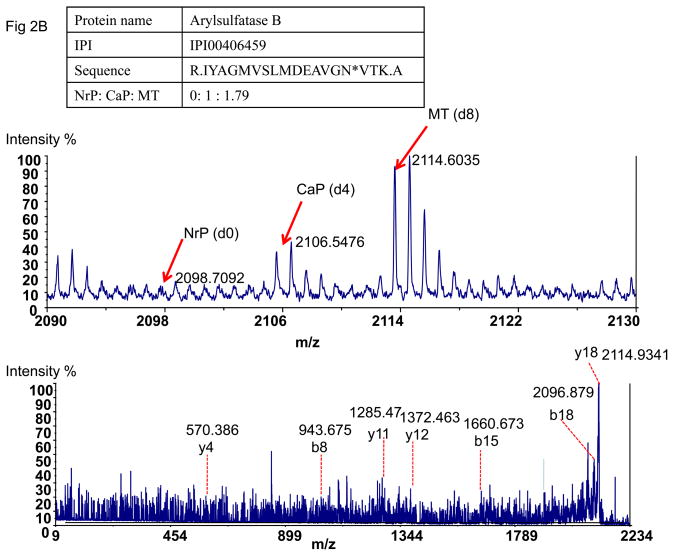
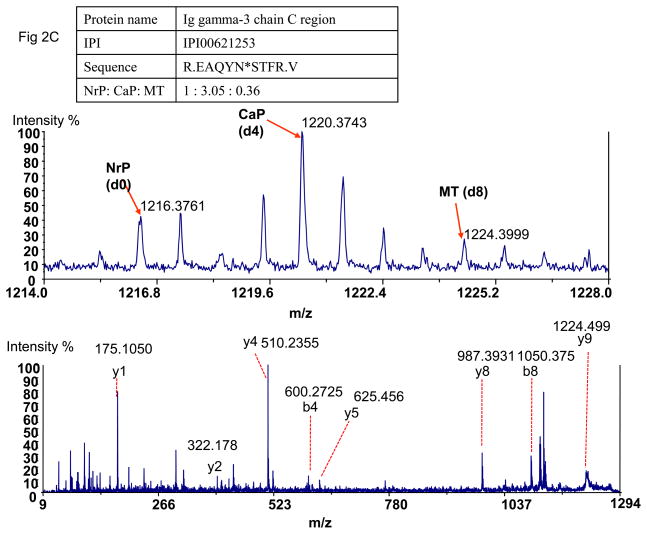
Figure 2.
Detection of tumor-specific proteins in plasma. A). The detected paired peaks of succinic anhydride labeled Tenascin-C and MS/MS spectrum of Tenascin-C. B) The paired peak of succinic anhydride labeled Arylsulfatase B and MSMS of Arylsulfatase B. C) The paired peak of succinic anhydride labeled Ig gamma-3 chain C region showed different peak pattern from Tenascin-C and MS/MS of Ig gamma-3 chain C region. NrP: Mouse plasma without carcinogen treatment; CaP: Mouse plasma from cancer-bearing mice after carcinogen treatment; MT: Mouse cancer tissues.


