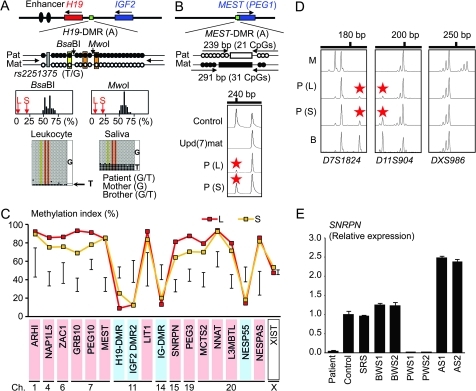
Figure 1.
Representative molecular results. Pat, paternally derived allele; Mat, maternally derived allele; P, patient; M, mother; B, brother; L, leukocytes; and S, salivary cells. Filled and open circles in A and B represent methylated and unmethylated cytosine residues at the CpG dinucleotides, respectively. A. Methylation patterns of the H19-DMR (A) harbouring 23 CpG dinucleotides and the T/G SNP (rs2251375) (a grey box). The PCR products are digested with BsaBI when the cytosine at the sixth CpG dinucleotide (highlighted in yellow) is methylated and with MwoI when the two cytosines at the ninth and the 11th CpG dinucleotides (highlighted in orange) are methylated. For the bio-COBRA data, the black histograms represent the distribution of methylation indices (%) in 50 control participants, and L and S denote the methylation indices for leukocytes and salivary cells of this patient, respectively. For the bisulfite sequencing data, each line indicates a single clone. B. Methylated and unmethylated allele-specific PCR analysis for the MEST-DMR (A). In a control participant, the PCR products for methylated and unmethylated alleles are delineated, and the unequal amplification is consistent with a short product being more easily amplified than a long product. In a previously reported patient with upd(7)mat,8 the methylated allele only is amplified. In this patient, major peaks for the methylated allele and minor peaks for the unmethylated allele (red asterisks) are detected. C. Methylation patterns for the 18 DMRs examined. The DMRs highlighted in blue and pink are methylated after paternal and maternal transmissions, respectively. The black vertical bars indicate the reference data (maximum–minimum) in 20 normal control participants, using leukocyte genomic DNA (for the XIST-DMR, 16 female data are shown). D. Representative microsatellite analysis. Minor peaks (red asterisks) have been identified for D7S1824 and D11S904 but not for DXS986 of the patient. Since the peaks for D7S1824 and D11S904 are absent in the mother and clearly present in the brother, they are assessed to be of paternal origin. E. Relative expression level (mean ± SD) of SNRPN on chromosome 15. The data have been normalised against TBP. SRS, an SRS patient with an epimutation (hypomethylation) of the H19-DMR; BWS1, a BWS patient with an epimutation (hypermethylation) of the H19-DMR; BWS2, a BWS patient with upd(11)pat; PWS1, a PWS patient with upd(15)mat; PWS2, a PWS patient with an epimutation (hypermethylation) of the SNRPN-DMR; AS1, an Angelman syndrome (AS) patient with upd(15)pat; and AS2, an AS patient with an epimutation (hypomethylation) of the SNRPN-DMR.

