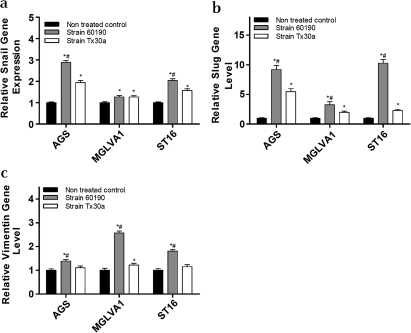
Figure 1.
Epithelial:mesenchymal transition gene expression following co-culture of gastric epithelial cells with Helicobacter pylori pathogenic (60190) and non-pathogenic (Tx30a) strains. (a) Snail gene expression: *significantly higher gene expression level compared with untreated control cells (strain 60190 treated: AGS p<0.001, MGLVA1 p<0.05, ST16 p<0.005; strain Tx30a treated: AGS p<0.005, MGLVA1 p<0.05, ST16 p<0.02); #significantly higher gene expression level compared with Tx30a treated cells (AGS p<0.05, ST16 p<0.05). (b) Slug gene expression: *significantly higher gene expression level compared with untreated control cells (strain 60190 treated: p<0.001 in all cell lines; strain Tx30a treated: AGS p<0.001, MGLVA1 p<0.005, ST16 p<0.005); #significantly higher gene expression level compared with Tx30a treated cells (AGS p<0.04, MGLVA1 p<0.05, ST16 p<0.002). (c) Vimentin gene expression: *significantly higher gene expression level compared with untreated control cells (strain 60190 treated: AGS p<0.05, MGLVA1 p<0.001, ST16 p<0.005; strain Tx30a treated: MGLVA1 p<0.05); #significantly higher gene expression level compared with Tx30a treated cells (MGLVA1 p<0.04). (n=3 replicates per condition and a representative graph is shown, error bars indicate 95% confidence).

