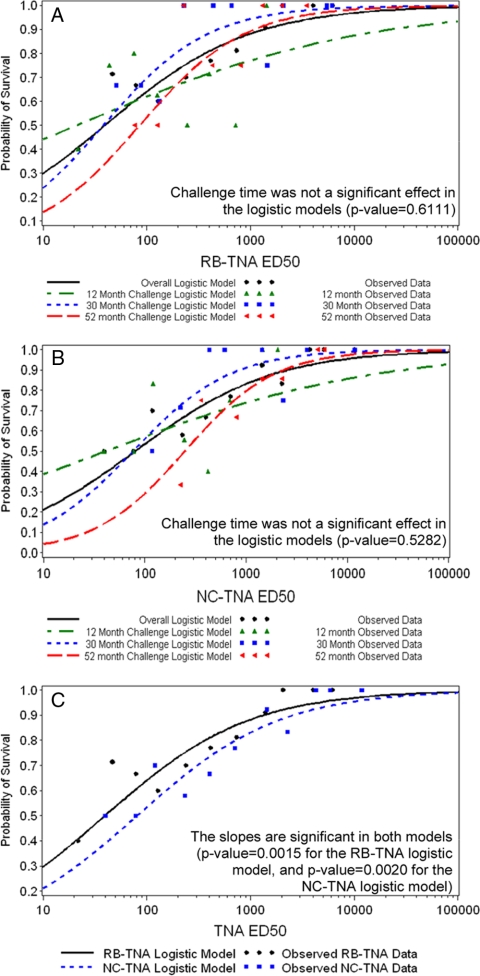
FIG. 4.
Logistic regression curves of log10 ED50 titers from week 30 postvaccination samples. Logistic regression curves were fitted to the log10 ED50 data using the 30-week postvaccination samples (n = 101) from both the NC- and RB-TNA assays to determine if the assays were predictive of survival. (A) First, models were fitted to the log10 ED50 RB-TNA assay data by challenge month (12 months, green line, n = 39; 30 months, blue line, n = 33; 52 months, red line, n = 29). It was determined that challenge time was not a significant effect in the RB-TNA assay logistic models (P value of 0.6111), which permitted analysis of the RB-TNA assay data regardless of the challenge month (overall model, black line). (B) Next, the models were fitted to the log10 ED50 NC-TNA assay data by challenge month (12 months, green line, n = 39; 30 months, blue line, n = 33; 52 months, red line, n = 29). It was determined that challenge time was not a significant effect in the NC-TNA assay logistic models (P value of 0.5282), which permitted analysis of the NC-TNA assay data regardless of the challenge month (overall model, black line). (C) Finally, since the challenge times did not significantly affect the RB- and NC-TNA assay models, the overall models from the assays were combined and assessed together regardless of the challenge month (black line, RB-TNA assay; blue line, NC-TNA assay). From this analysis, it was found that the slopes are significant in both models (P value of 0.0015 for the RB-TNA assay logistic model and P value of 0.0020 for the NC-TNA assay logistic model); thus, both the NC- and RB-TNA assays were predictive of survival, regardless of the challenge month.

