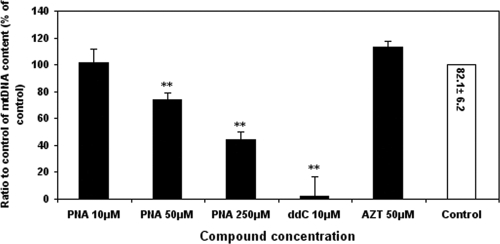
FIG. 5.
Effects of NRTI exposures on mtDNA levels. HepG2 cell cultures were exposed to different concentrations of the NRTIs listed. The ratios of mtDNA to nDNA were determined by real-time PCR, as described in Materials and Methods. Values represent the percentage of the values for 0.1% DMSO-treated control cultures and are the means plus SDs of three independent experiments. **, P < 0.001 by Dunnett's multiple-comparison test. The value in the control bar represents the absolute ratio of mtDNA/nDNA ± SEM for the control.

