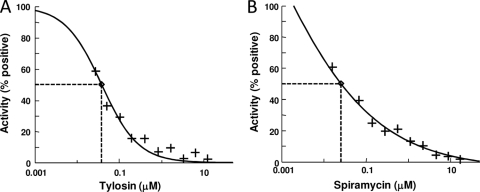
FIG. 2.
IC50 determination for positive controls in the A/T assay. Titrations of tylosin (A) and spiramycin (B) in the A/T assay are shown. The concentrations of tylosin and spiramycin ranged from 0.05 to 13.0 μM and 0.07 to 18 μM, respectively. The antibiotics were diluted into DMSO so that the concentration of DMSO was the same as that in the screening assays. Positive controls were assays in which there were no antibiotics and approximately 1,000 pmol of phenylalanine was synthesized. The curve fits and IC50s were determined by using XLfit (version 4.1; IDBS) as part of Microsoft Excel.

