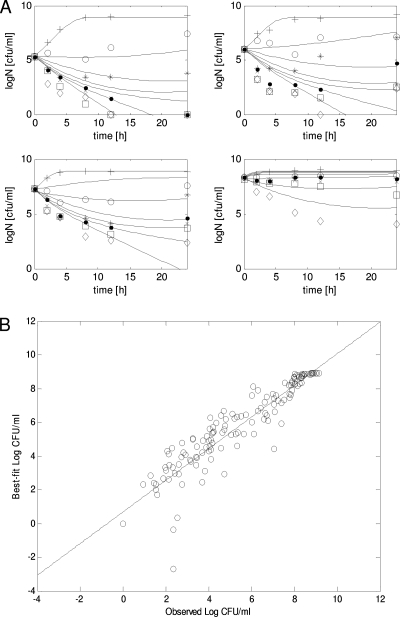
FIG. 2.
Model fits to the experimental data. (A) Overlay of experimental data with the best-fit model. (B) Correlation between observed and best-fit bacterial burdens. Symbols represent experimental data: +, placebo; ○, 0.25× MIC; *, 1× MIC; •, 4× MIC; ×, 16× MIC; □, 64× MIC; ⋄, 256× MIC. Solid lines depict the best-fit model. R2 = 0.88. The best-fit regression line is given as follows: best fit = 0.94 × observed + 0.68.

