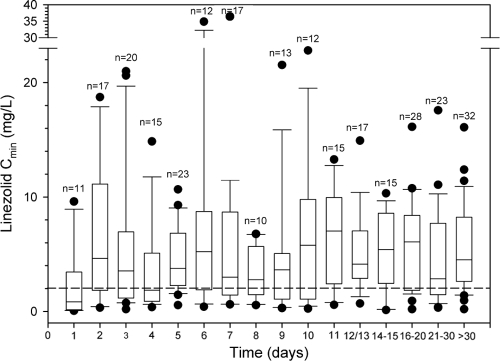
FIG. 5.
Box (median and 25th to 75th percentile) and whisker (5th and 95th percentile) plots of trough plasma concentrations (Cmin) of linezolid observed over time. Filled circles are outliers; n is the number of observations on each day of treatment. The dashed line refers to 2 mg/liter, namely, the MIC90 of linezolid for staphylococci and enterococci. Median Cmin was almost always above the MIC90 of linezolid for staphylococci and enterococci, regardless of the day of treatment.

