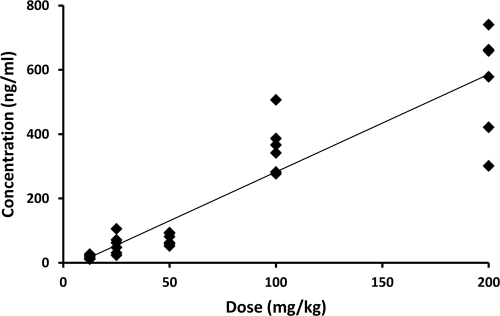
FIG. 3.
Plot of individual plasma TMC353121 concentrations determined in cotton rats 24 h after a single s.c. administration of a sustained-release formulation versus the dose. The doses given to cohorts of six animals were 12.5, 25, 50, 100, and 200 mg/kg. The solid line shows the fit of the data points by linear regression analysis (coefficient of correlation, 0.92).

