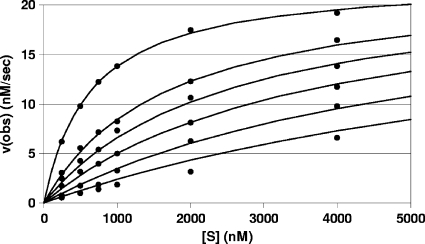
FIG. 2.
Steady-state kinetic data for inhibition of NCV genotype 1a NS3-NS4A protease by BI 201335. The concentration of substrate is shown on the x axis, and the observed maximum rate of metabolism [v(obs)] is shown on the y axis. The points shown correspond to experimental values at inhibitor concentrations of 0, 3.2, 5.5, 8.9, 15, and 24 nM. The lines show the best fit of the data to a competitive mechanism. The experiment was repeated twice, giving Ki values of 2.0 ± 0.1 and 3.3 ± 0.2 nM. Data from the first experiment are shown.

