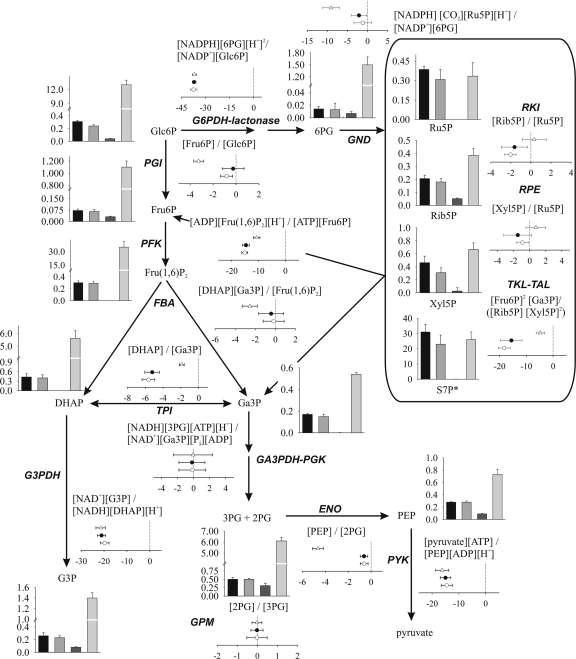
FIG. 2.
Results obtained from quantitative metabolomics and thermodynamic analysis of the central carbon metabolism. Concentrations of metabolites are given in μmol/g CDW, except for S7P (indicated by an asterisk), for which the relative MS signal per g CDW is shown. Metabolite pools obtained for BP10001, BP000, CEN.PK 113-7D on xylose, and CEN.PK 113-7D on glucose are shown as bars from left to right, respectively. Results from thermodynamic analysis are displayed as ΔΔG values (given in kJ/mol) for BP000 (open circles) and BP10001 (filled circles) on xylose and CEN.PK 113-7D on glucose (open triangles). Corresponding numbers are summarized in Tables S3 and S4 in the supplemental material.

