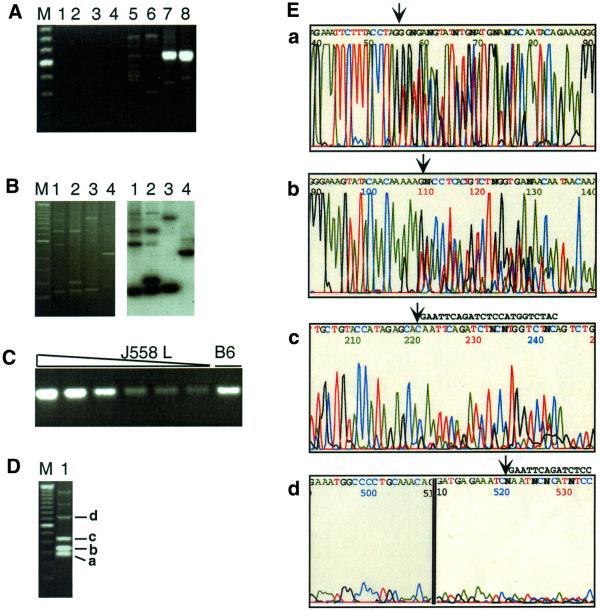
Figure 2.
Specificity of amplification and batch sequence analysis. (A) Agarose gel electrophoresis of amplification products. Amplification reactions used the λ1-specific primer set LRB3, LR4d and LR4e to detect top strand breaks. Extension reactions were carried out in the absence of template DNA (lanes 1 and 2) or linker (lanes 3 and 4). Template for extension was genomic DNA (2000 cell-equivalents) from the murine B cell line J558L, either undigested (lanes 3–6) or digested with SpeI (lanes 7 and 8). After the linker ligation step, one-eighth of each extension reaction (250 cell-equivalents of DNA) was amplified by nested PCR and products resolved by agarose gel electrophoresis and stained with ethidium bromide. Lane pairs represent duplicate reactions. M is the 100 bp ladder (Gibco BRL) marker and the intense band is 600 bp. (B) Breaks were amplified in reactions that used as template DNA from primary murine B cells and the primer set LRB, LR2 and LR3. Products were resolved by agarose gel electrophoresis, visualized by ethidium bromide staining (left), then blotted, probed with the 32P-labeled λ1-specific oligonucleotide, LR3a, and autoradiographed (right). (C) A 472 bp fragment from the Jλ1–Cλ1 intron was amplified using primers LF7 and LR4a. The amount of J558L genomic DNA was, from left to right, 2000, 1000, 500, 200, 100 and 50 cell-equivalents. The sample in the right hand lane (B6) was amplified using template genomic DNA from a C57BL/6 mouse, and was estimated to correspond to 500 cell-equivalents by FACS. (D) Products of a single amplification reaction analyzed by gel electrophoresis and ethidium bromide staining. Template DNA was isolated from B cells from mice that carry a λ1 transgene (6) and amplified using the primer set LRB3, LR4d and LR4e. M is the 100 bp ladder (Gibco BRL) marker. Bands a–d correspond to sequenced regions shown in the corresponding panels of Figure 2E. (E) Batch sequence analysis of products of the amplification reaction shown in Figure 2D. Sequence analysis was carried out on an ABI 377 Sequencer, using oligonucleotide LR5b as the primer. The four regions of the sequence trace correspond to bands a–d in Figure 2D, which are 78, 132, 243 and 543 bp in length, respectively, as determined by sequence analysis. The arrows mark the positions at which the linker sequence interrupts the λ1 gene sequence. The linker sequence, GAATTCAGATCTCCATGGTCTAC, can be read easily in the regions of the trace shown in panels c and d, where the linker sequence is shown to the right of the arrow.

