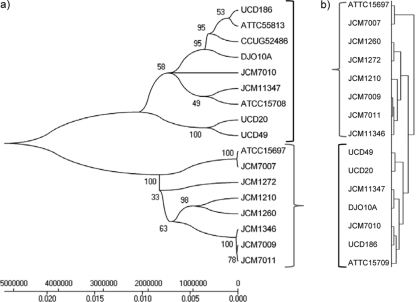
FIG. 1.
Evolutionary relationship of B. longum spp. strains used in the study. (a) The MLST-based hierarchical clustering was inferred using the minimum-evolution method (35). The optimal tree with the sum of branch length of 0.12 is shown. The percentage of replicate trees in which the associated taxa clustered together in the bootstrap test (1,000 replicates) is shown next to the branches (12). The phylogenetic tree was linearized assuming equal evolutionary rates in all lineages (47). The clock calibration to convert distance to time was 2.1 × 10⁸ (time/node height). The tree is drawn to scale, with the branch lengths being in the same units as those of the evolutionary distances used to infer the phylogenetic tree. The evolutionary distances were computed using the maximum-composite-likelihood method (49) and are in units of the number of base substitutions per site. Phylogenetic analyses were conducted in MEGA (version 4) (48). Sequence fragments for the seven MLST loci of B. longum ATCC 55813 and B. longum CCUG 52486 were obtained from NCBI. (b) Hierarchical clustering (Euclidian distance, average linking) based on the entire CGH data set and performed in MeV using the HCL algorithm.

