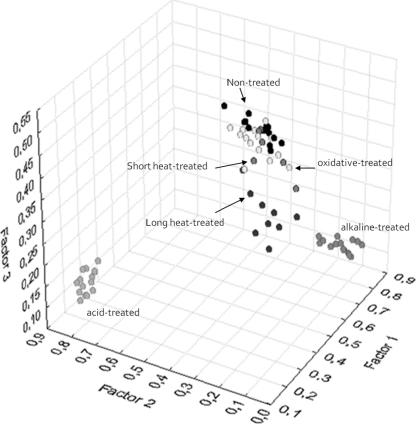
FIG. 3.
Scatter plot obtained from factor analysis of the w4 (1,200 to 900 cm−1) spectral region, showing in gray scale the distribution of nontreated samples and acid-treated, alkaline, short-time heat-treated (3 and 6 min at 55°C), long-time heat-treated (9, 12, and 15 min at 55°C), and oxidative stress-treated samples. Three replicates of each experimental condition are represented.

