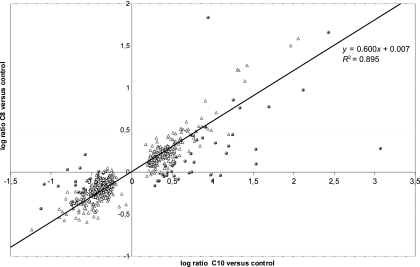
FIG. 2.
Correlation between the two responses. Triangles, expression ratio of genes whose expression level varied significantly compared to that of the control for one modality; spheres, expression ratio of genes whose expression level varied significantly for C8 compared to that of C10; these points were excluded for the estimation of the correlation between the two responses.

