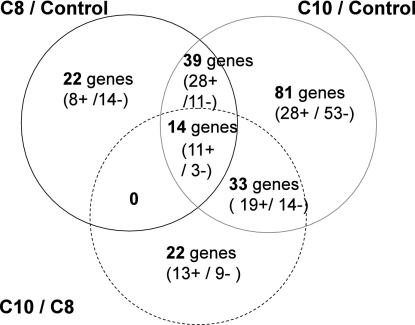
FIG. 3.
Venn diagram presenting the genes differentially expressed in these three conditions. C8, 20-min exposure to octanoic acid at 50 mM; C10, 20-min exposure to octanoic acid at 50 mM; C8/C10, comparison of exposure to C10 to exposure to C8. Repressed genes are followed by a minus sign; induced genes are followed by a plus sign.

