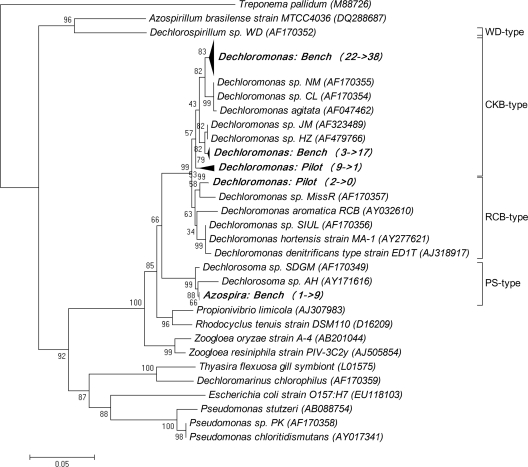
FIG. 3.
Phylogenetic tree of perchlorate-reducing bacteria in the two BAC reactors before and after phosphorus addition. The two numbers in parentheses represent the numbers of the clones before and after phosphorus addition. The numbers in the tree refer to percentage bootstrap values based on 1,000 replications. The bar represents 5% sequence divergence.

