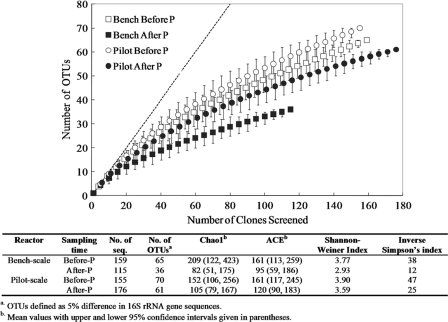
FIG. 4.
Rarefaction curves indicating bacterial 16S rRNA gene richness within clone libraries from the bench- and the pilot-scale BAC reactors before and after phosphorus addition. The dashed line represents 1:1, indicating infinite diversity. The table lists the bacterial 16S rRNA gene sequence diversity indices. OTUs were defined as groups of sequences sharing 95% 16S rRNA gene sequence identity. The estimates of phylotype richness were calculated according to the abundance-based coverage estimate (ACE) and the bias-corrected Chao1 estimator. The Shannon-Weiner diversity index and the inverse Simpson diversity index, which take into account species richness and evenness, were also calculated.

