Fig. 5.
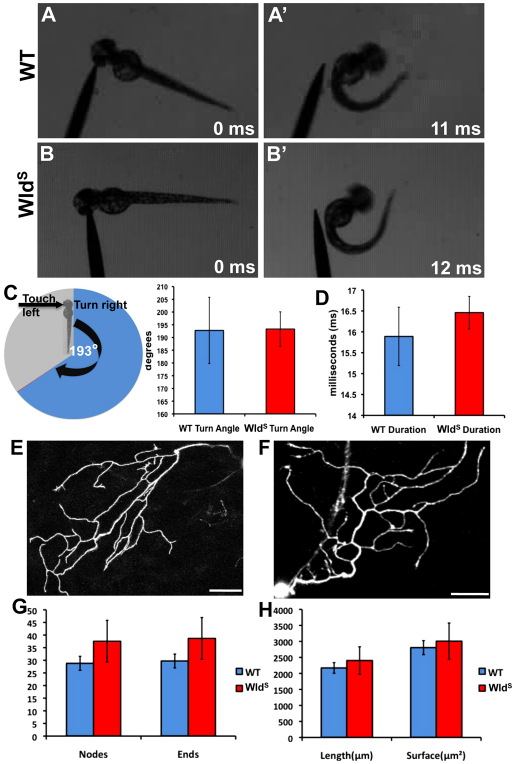
Behavioral escape responses and peripheral axon morphology of wild-type and WldS larvae are indistinguishable. (A,A′) 48 hpf wild-type larvae touched on the left side of the head (A) escape to the right (A′). (B,B′) This behavior is similar in 48 hpf WldS larvae. (C) Quantification of turn angle in wild-type and WldS larvae. Pie chart displays a cartoon fish turning 193° in the opposite direction to the touch stimulus. On the right, a bar graph shows that wild type (blue bar, n=9) and WldS (red bar, n=24) both turn an average of 193° (P=0.9676). (D) Quantification of escape response duration in wild type and WldS. Wild-type duration (blue bar, n=9) was not significantly different from WldS duration (red bar, n=24) (P=0.4624). (E,F) Confocal image stack projections of representative 54 hpf wild-type (E, n=15) and WldS (F, n=15) peripheral axons. Single neurons were traced in three dimensions (see Materials and methods). (G) Quantification of the number of nodes (branch points) and branch ends in wild-type (blue bars) and WldS (red bars) axons were not significantly different (nodes, P=0.3260; ends, P=0.3123). (H) Quantification of total length and surface area of wild-type (blue bars) and WldS (red bars) axons revealed no significant difference between the two groups (length, P=0.6182; surface area, P=0.7416). Error bars indicate s.e.m. Scale bars: 50 μm.

