Fig. 3.
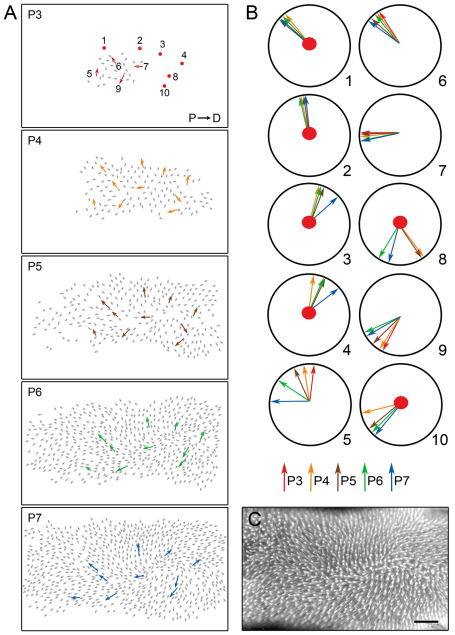
Live imaging of Fz6–/–;K17-GFP follicles on the mouse dorsal foot between P3 and P7. (A) Vector maps with ten representative follicles highlighted and numbered. Proximal (P) is to the left and distal (D) is to the right. (B) Polar plot of the orientations of the numbered follicles. Follicles 1-4, 8 and 10 were too immature and/or not sufficiently angled with respect to the skin surface to score at P3; this time point is represented by the central circle on the polar plot. (C) Live foot at P7 showing K17-GFP fluorescence in follicles. This image corresponds to the adjacent P7 vector map. Scale bar: 500 μm.

