Fig. 6.
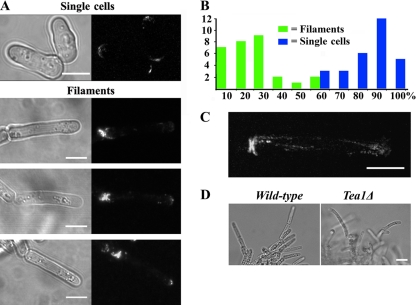
Tea1 abundance at the growing tip is reduced in filamentous cells. (A) Tea1-3GFP distribution in single cells and filaments (strain JA1489). In single cells, Tea1-3GFP is located equally at both tips. In filaments, it is enriched strongly at the nongrowing end. Bars, 5 μm. (B) Quantitation of Tea1-3GFP distribution. Maximum-intensity stacks of Tea1-3GFP fluorescence were collected for both singly growing and filamentous cells of strain JA1489. The graph shows the fluorescence intensity of Tea1-3GFP at the growing end of the filament as a percentage of the intensity at the nongrowing end, plotted as 10% bins. For single cells, the fluorescence from the end with weaker intensity is plotted relative to the intensity from the other end. A total of 29 cells or filaments were examined. (C) Time-lapse imaging of Tea1-3GFP delivery to the tip of a filamentous cell in strain JA1489 (see Movie S2 in the supplemental material). Tea1-3GFP appears to be delivered equally to both ends of the filament. The image shows a maximum-intensity stack taken at 10-s intervals over 480 s. Bar, 5 μm. (D) A strain deleted for Tea1 (strain JA1567) produces filaments that are bent, resulting in aberrant mycelial morphology compared to that of the wild type (see Movie S3 in the supplemental material). Bar, 10 μm.

