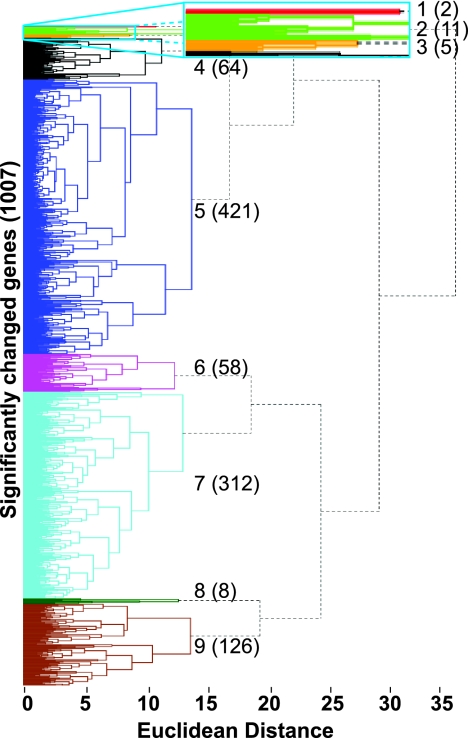
Fig. 2.
Hierarchical cluster analysis of all three microarray data sets (hypoxia, ketoconazole, and upc2Δ). Analysis of 1,007 genes in total. Each cluster is represented by a different color. The numbers to the right represent the clusters, with the number of genes in each cluster shown in parentheses. The blue rectangular box at the top is a close-up view of tightly bunched clusters 1, 2, and 3. The major GO category represented by each cluster is shown in Table 3.

