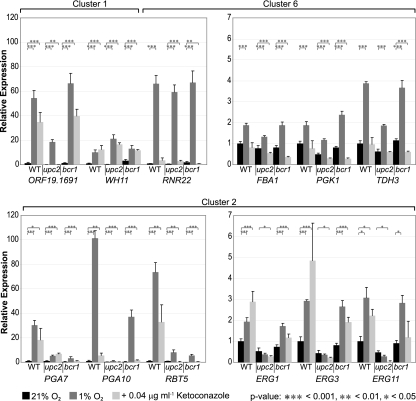
Fig. 4.
Quantitative RT-PCR analysis of gene expression. Genes from clusters 1, 2, and 6 are indicated. Four independent biological replicates were used, except for with treatment of the wild type (WT) with ketoconazole (3 replicates) and measurement of ERG11 expression (2 replicates). Expression was normalized against 18S rRNA and is shown relative to expression of the wild type, with associated standard deviations. *, P < 0.05; **, P < 0.01; ***, P < 0.001.

