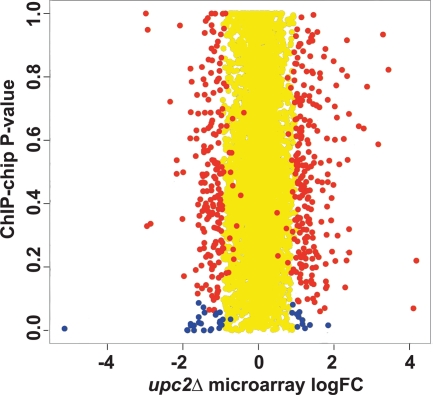
Fig. 5.
Comparison of genes that are differentially expressed in a upc2Δ deletion background in microarrays to those bound by Upc2. The log fold changes in expression of the genes in the upc2Δ arrays (x axis) were plotted against the P values from the ChIP-chip array data from Znaidi et al. (91), which identified promoters bound by Upc2 (y axis). Yellow spots represent genes with a log fold change of expression of less than 1. Red spots represent genes with significant changes in expression (P < 0.05) in the upc2Δ array data but with a P value greater than 0.1 (nonsignificant) in the ChIP-chip data. Blue spots represent 38 genes with significant changes in expression in the upc2Δ arrays and with significant binding in the ChIP-chip experiments. The genes are listed in Table 4.

