
FIG. 1.
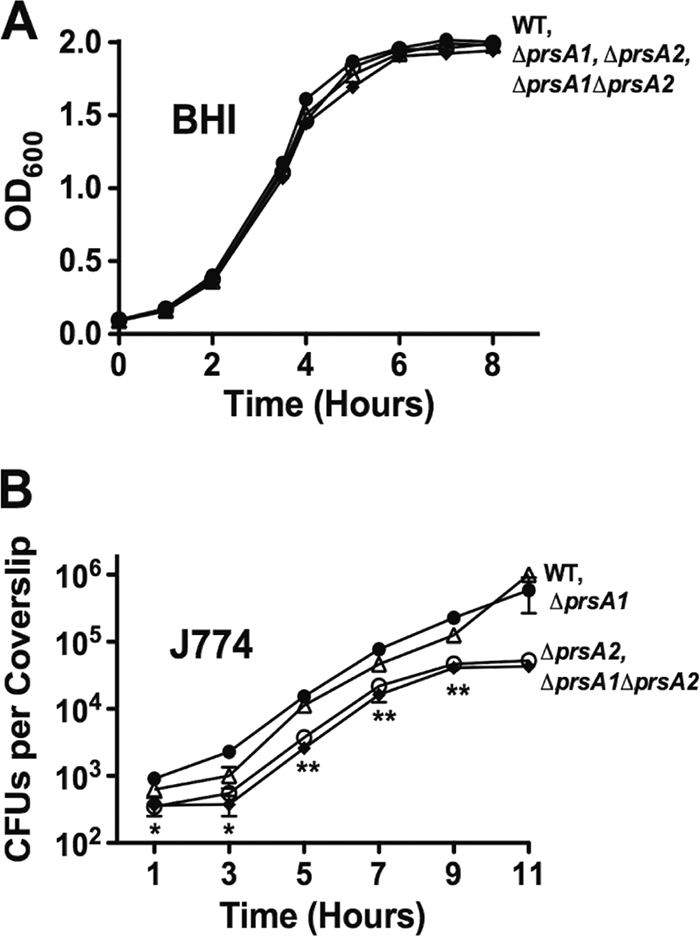
L. monocytogenes ΔprsA1 ΔprsA2 mutants exhibit normal growth patterns in broth culture and resemble single ΔprsA2 mutants in infected tissue culture cells. (A) Bacterial growth in BHI broth as determined by optical density measurements at 600 nm. The data shown are representative of results from three independent experiments, each performed in duplicate. (B) J774 macrophage-like cells were infected at an MOI of 0.1 bacterium to 1 macrophage, and intracellular bacterial replication was measured at the indicated time points following the addition of gentamicin (30 μg/ml) at 1 h postinfection. Data shown are the averages of results from three independent experiments. •, wild type; ○, ΔprsA2 mutant; ▵, ΔprsA1 mutant; ♦, ΔprsA1 ΔprsA2 mutant. Statistical significance was determined using one-way analysis of variance with Tukey's multiple comparison test (*, P < 0.01; **, P < 0.001).