FIG. 1.
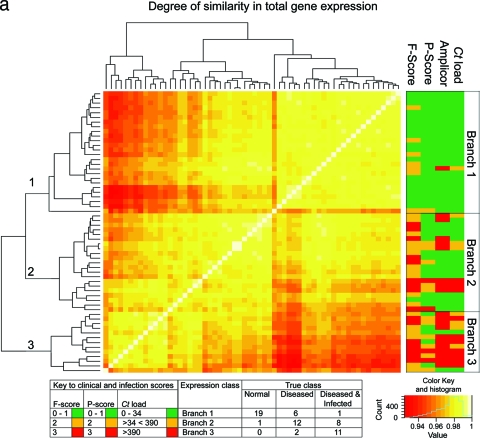
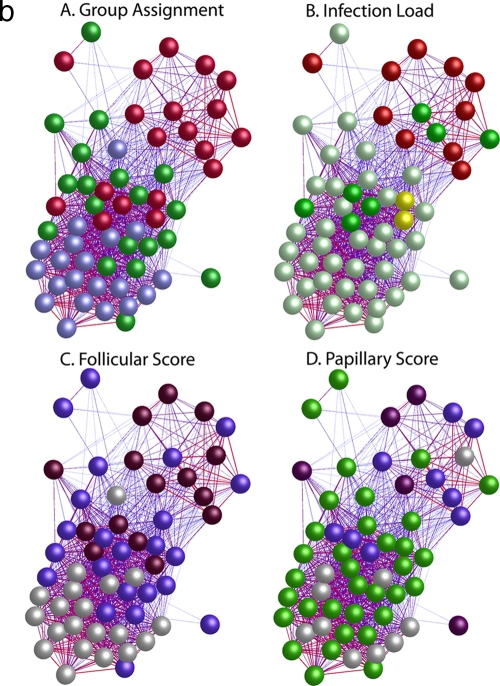
(a) Similarity of global gene expression clusters samples into three distinct groups. The axes of the matrix are clustered with a simple tree, which represents sample distance based on the global similarity of gene expression (sample-to-sample Pearson correlation coefficient). The trachoma clinical grading and infection scores are shown on the right hand side (F, follicular score; P, papillary hypertrophy score; Amplicor, C. trachomatis PCR positive or negative; C. trachomatis load, qPCR estimate of the number of C. trachomatis ompA copies per swab). The genome-wide expression profiles of conjunctival tissue from 60 Gambian subjects resident in communities where trachoma is endemic were used to construct the 60-by-60 matrix. The expression across all 54,675 probe sets on the HG-U133 plus 2.0 GeneChip were used. Three main branches (1, 2, and 3) cluster the samples into groups based on the biological signature of their overall gene expression profile. Samples defined by a branch share the greatest similarity with each other. Overall, the separation achieved by the unsupervised clustering of the samples has a true class accuracy value of 70% and implies that the three groups have a different expression signature. (b) Sample-to-sample correlation network represented in BioLayout Express3D. A matrix file was generated by comparing the overall expression pattern of all samples (as in panel a) and used to generate a graph of the data. In this context, nodes represent samples and the edges correlation values between them greater than the selected threshold (r = 0.95). The thicker/redder is the edge, the higher is the sample-to-sample correlation that it represents. Panel A, nodes colored light blue represent samples derived from healthy participants showing no clinical signs of disease or infection, those colored green represent participants who had clinical signs of disease but no detectable infection, and those colored red represent participants with clinical signs of disease and C. trachomatis infection. Panel B, nodes colored gray represent samples derived from participants showing no detectable levels of infection, those in yellow represent those with C. trachomatis loads of <34 copies per swab, those in green represent C. trachomatis loads of 34 to 389, and those in red represent loads f >390. Panel C, nodes colored gray represent participants with an F score of 0, those colored blue represent participants with an F score of 2, and those colored maroon represent participants with an F score of 3. Panel D, nodes colored gray represent participants with a P score of 0, those colored green represent participants with a P score of 1, those colored blue represent participants with a P score of 2, and those colored maroon represent participants with a P score of 3.


