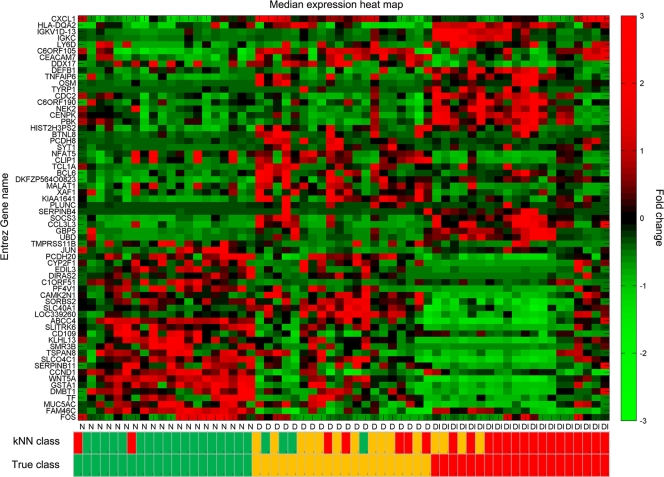
FIG. 3.
Classification of individuals based on differentially expressed transcripts. Transformed expression levels are indicated by the color scale, with red representing relatively high expression and green indicating relatively low expression compared to the median expression for each gene across all participants. Hierarchical clustering of 63 gene classifiers obtained from selecting genes with >2-fold changes in expression which are unique to each participant category is shown. Selection of a small subset from the largest group of uniquely expressed genes (1,644 in the disease and infection class) was based on the fold change and absence of correlation of expression with the genes identified for the other unique classes (23 genes in each). Selection of a relatively small list of genes as potential biomarkers is a requirement for the application of computationally efficient methods. A supervised learning algorithm (kNN) was used to test the capacity of the classifier subset of genes to discriminate three classes of participants. Leave-one-out cross-validation of the training set with 63 genes classified the samples with 75% accuracy. The predicted class is indicated by light-color solid rectangles (green for healthy participants, amber/yellow for participants with clinical disease signs only, and red for participants with disease signs with current ocular C. trachomatis infection). Participants from all categories are misclassified; however, misclassified participants are those with disease signs only (9/20). Two patients with clinical disease and infection were classified as healthy uninfected participants, and no healthy participants were classified as diseased and infected.

