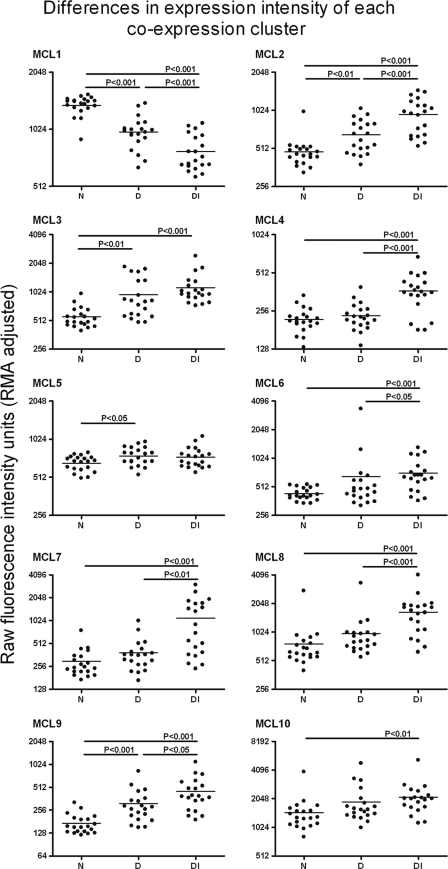
FIG. 6.
Mean expression levels of all the transcripts in a coexpression cluster for each array are summarized as a single point for each array. Differences in the expression level for each transcript cluster between each clinical and infection category was then tested by analysis of variance. Where differences between the groups are significant, they are indicated with the appropriate P value, and this indicates where the changes of expression are attributable.

