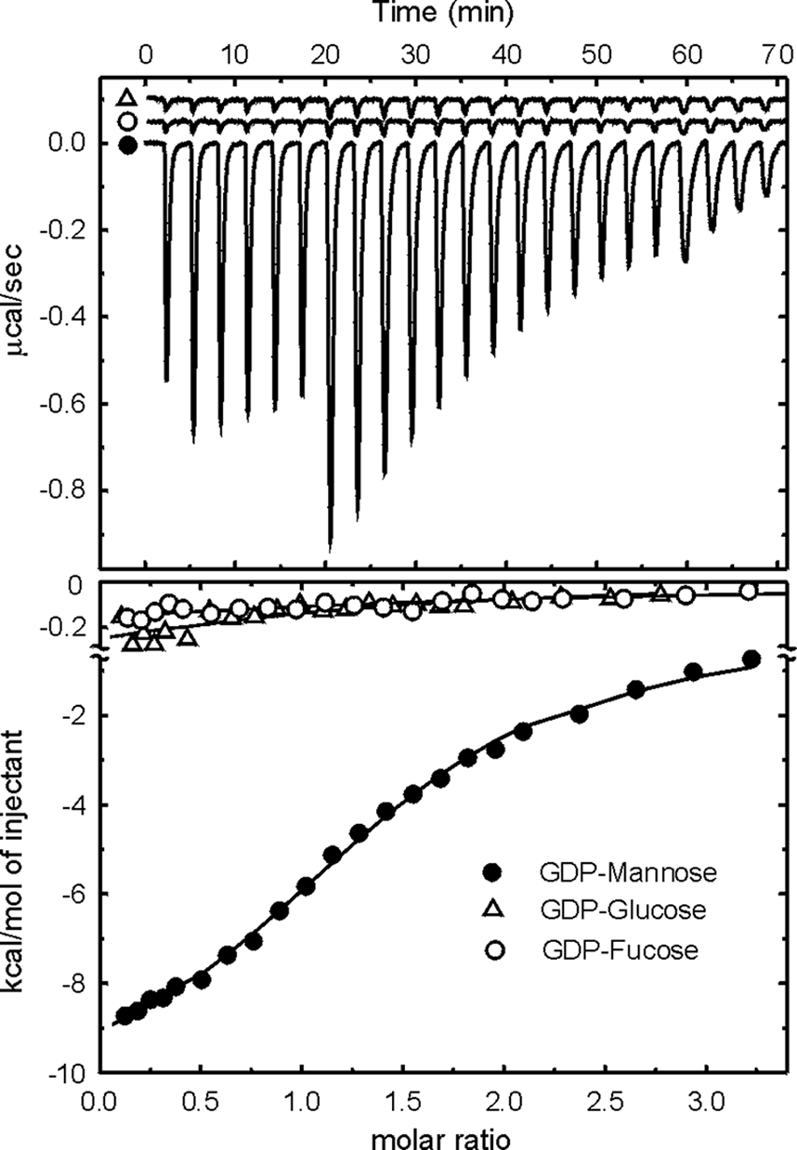
FIG. 5.

ITC measurements of enzyme-substrate interactions. The upper panel shows the titrations of B736L with GDP-mannose, GDP-glucose, or GDP-fucose. The lower panel shows the heat released when a substrate binds to the enzyme as a function of relative concentrations. Corrections have been made for the heat release due to dilution. Solid lines correspond to the best fit of data using a bimolecular interaction model.
