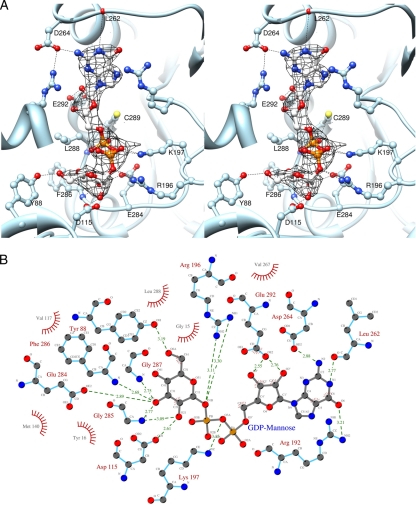
FIG. 6.
Structure of B736L in a complex with the donor substrate GDP-mannose. (A) Stereodiagram showing the interaction between GDP-mannose and protein residues. The GDP-mannose and the protein residue side chains are shown as ball-and-stick representations. Carbon, nitrogen, and oxygen atoms in the substrate are colored gray, blue, and red, respectively. The (Fo − Fc) electron density map is contoured at 2.6 sigma. (B) Schematic diagram showing the interactions between B736L and GDP-mannose. Distances are given in angstroms. Carbon, nitrogen, and oxygen atoms are labeled Cx, Nx, and Ox, respectively.

