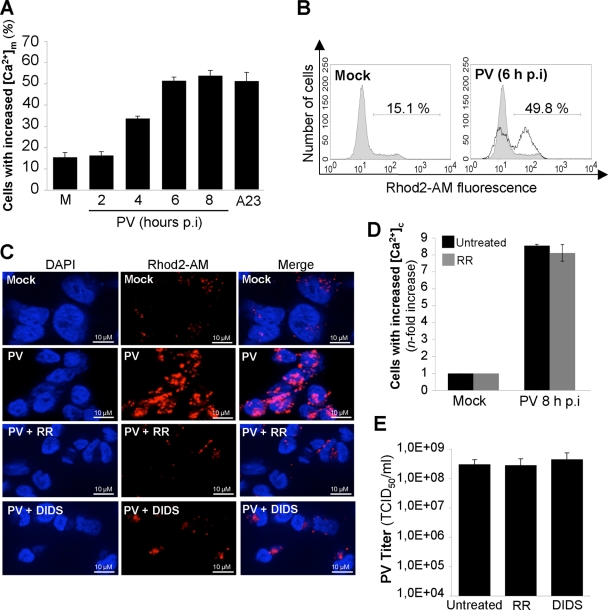
FIG. 5.
PV induces mitochondrial Ca2+ uptake via the mitochondrial Ca2+ uniporter and VDAC in IMR5 cells. (A) Time course of the increase in mitochondrial Ca2+ concentration ([Ca2+]m) in PV-infected IMR5 cells. At the indicated times p.i., mitochondrial Ca2+ levels were measured by flow cytometry with Rhod2-AM. Mock-infected (M) and A23-treated (A23) IMR5 cells were used as negative and positive controls, respectively. The graph shows the mean percentages of Rhod2-AM-fluorescent cells obtained from three independent experiments. Error bars indicate the standard errors of the means. (B) Representative flow cytometry histograms after Rhod2-AM staining of mock-infected and PV-infected (6 h p.i.) IMR5 cells. The profiles of mock-infected control cells (gray area) and PV-infected cells (blank area) are shown. The percentages of Rhod2-AM-fluorescent cells for each of two experimental conditions are indicated. (C) Reduction of mitochondrial Ca2+ level in PV-infected IMR5 cells treated with RR or DIDS, antagonists of the mitochondrial Ca2+ uniporter and VDAC, respectively. IMR5 cells were mock infected or infected with PV (6 h p.i.) in the presence or absence of RR (2 μM) or DIDS (10 μM). Cells were analyzed by fluorescence microscopy after Rhod2-AM staining (red; middle). Nuclei were stained with 4′,6-diamidino-2-phenylindole (DAPI; blue; left). The merged image is an overlay of the DAPI and Rhod2-AM images (right). (D) The treatment of IMR5 cells with RR does not affect the PV-induced increase in cytosolic Ca2+ concentration ([Ca2+]c). Mock-infected and PV-infected (8 h p.i.) IMR5 cells treated with 2 μM RR (gray) or not treated (black) were analyzed by flow cytometry after FLUO3-AM staining. The increase (n-fold) in cytosolic Ca2+ was calculated as the ratio of the percentage of fluorescent PV-infected IMR5 cells to the percentage of fluorescent mock-infected cells. The data shown are the means from three independent experiments. Error bars indicate the standard errors of the means. *, P < 0.05 by Student's t test comparing untreated IMR5 cells to treated IMR5 cells. (E) The treatment of IMR5 cells with RR or DIDS does not affect PV growth in IMR5 cells. IMR5 cells were infected with PV for 8 h in the presence or absence of RR (2 μM) or DIDS (10 μM). Total virus yield (extracellular and intracellular) was determined by TCID50 assay after three cycles of freezing and thawing to release intracellular viruses. Each point represents the mean virus titers for three independent experiments. Error bars indicate the standard errors of the means.

