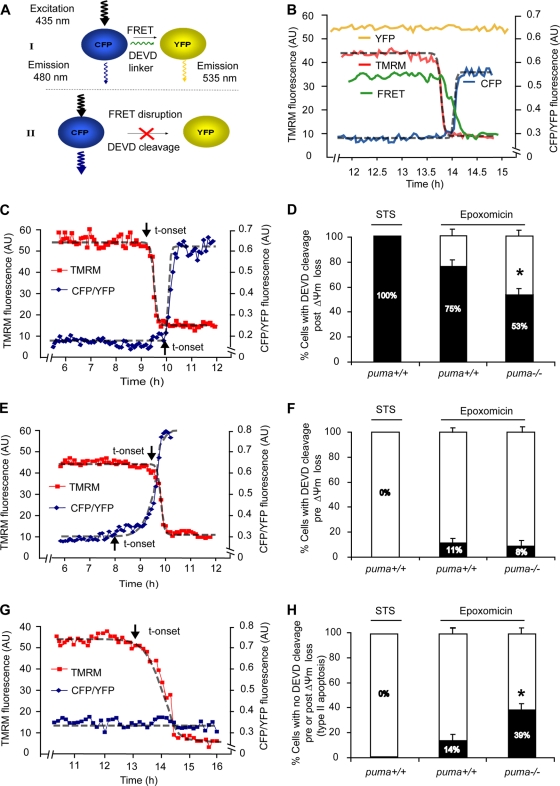
FIG. 5.
FRET-based single-cell analysis of caspase-3-like activity and mitochondrial membrane potential in WT and puma−/− neurons reveals caspase-dependent and caspase-independent cell death. (A and B) The SCAT3 FRET probe used consisted of CFP and YFP fluorophores linked together by a region containing the caspase-3 substrate sequence DEVD. Upon cleavage of the DEVD linker, the fluorescent resonance energy transfer (FRET) excitation between CFP and YFP is disrupted and detected by a decrease in FRET fluorescent intensity. This results in an increased energy transfer to CFP, as detected by an increase in CFP fluorescence. YFP excitation was used as a control for changes in fluorescence not directly related to probe cleavage, such as changes in cell volume, and therefore the data are expressed as a ratio of CFP to YFP. TMRM is used as a Δψm indicator in the nonquenched mode and measured in parallel. Here, WT neurons were treated with STS (300 nM, 8 h), or WT and puma−/− neurons were treated with epoxomicin for 24 h on the stage of a Zeiss 5Live confocal microscope. Fluorescent measurements were captured for TMRM, FRET, CFP, and YFP in real-time. All neurons that lost Δψm were categorized into those where DEVD cleavage occurred prior to Δψm loss or post-Δψm loss or those in which no DEVD cleavage was detected. Sigmoidal fits were applied to traces and the point initiation of onset (indicated by arrows) or endpoints determined as previously described (48). (C, E, and G) Representative traces of cells which undergo FRET disruption post-Δψm loss (C) or prior to Δψm loss (E) or which undergo Δψm loss in the absence of FRET disruption (G). t-onset, time of onset. (D, F, and H) Quantification of the number of cells in STS-treated WT neurons (n = 11) or in epoxomicin (50 nM, 24 h)-treated WT (n = 75) and puma−/− (n = 96) neurons with FRET disruption either prior to Δψm loss (D) or post-Δψm loss (F) or cells which undergo Δψm loss in the absence of FRET disruption (H). Data were obtained from 6 (WT-STS), 20 (WT-epoxo), and 28 (puma−/−-epoxo) separate experiments from 5 to 25 independent cultures. All data are means ± SEM. *, P < 0.05 compared to WT (D to H) as assessed by Fisher's exact t test.

