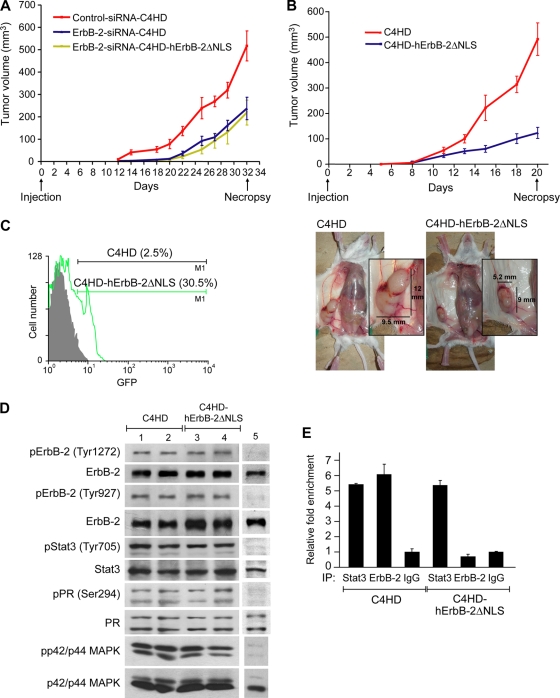
FIG. 7.
In vivo blockage of ErbB-2 nuclear localization. (A and B) Cells (106) from each experimental group were inoculated subcutaneously (s.c.) into mice treated with MPA, and tumor volume was calculated as described in Materials and Methods. (Bottom) Decrease in tumor mass in mice injected with C4HD-hErbB-2ΔNLS cells compared to mice injected with C4HD cells. Each point represents the mean volume ± SEM for six independent tumors for all experimental groups except for the ErbB-2-siRNA-C4HD and ErbB-2-siRNA-C4HD-hErbB-2ΔNLS groups, which contained four tumors. (C) Content of hErbB-2ΔNLS. GFP expression levels were determined by flow cytometry. Shown is a representative sample of each tumor type. (D) Tumor lysates were analyzed by Western blotting with the indicated phosphoprotein antibodies, and membranes were reprobed with their respective total protein antibodies. Shown are two representative samples of mice injected with C4HD cells (lanes 1 and 2) and with C4HD-hErbB-2ΔNLS cells (lanes 3 and 4). Lane 5, C4HD cells not treated with MPA, used as a control for the protein phosphorylation state. (E) ChIP analysis of tumor samples. DNA-protein complexes were pulled down with Stat3 and ErbB-2 antibodies or with control IgG, and the resulting DNA was amplified by qPCR using primers indicated in Fig. 5. Results are expressed as n-fold over the IgG control and represent the averages of data from three replicates ± SEM. Shown are data for a representative sample of each tumor type.

