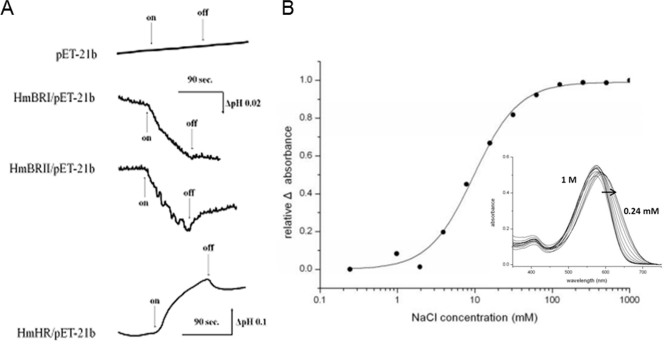
FIG. 6.
Measurement of light-driven transport of ions. (A) A suspension of E. coli cells expressing HmBRI, HmBRII, or HmHR alone was used to measure light-induced pH changes. The beginning and end of illumination using a 10-mW, 532-nm continuous green laser are indicated by the arrows labeled “on” and “off,” respectively. (B) Chloride binding affinity determination for HmHR. The inset shows the spectral shifts of HmHR in different chloride concentrations. The direction of shift from high- to low-salt concentration is marked by an arrow.

