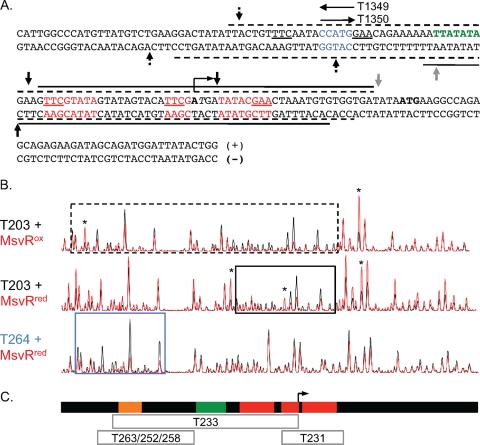
FIG. 4.
(A) The msvR and fpaA intergenic region, displayed with corresponding DNase I footprints. The footprints for each strand are displayed with a dashed line for those generated with MsvRox and with a solid line for those generated with MsvRred. The PfpaA TATA box is shown in green, and its transcription start site is identified. The putative binding site sequences identified in Fig. 1 are shown in red. The region of sequence overlap between T1349 and T1350 is shown in blue. Vertical arrows above and below each strand depict hypersensitive sites. Hypersensitive sites present in the oxidized, reduced, or both footprints are depicted by a dotted arrow, solid black arrow, and a solid gray arrow, respectively. (B) Aligned chromatograms of MsvRox and MsvRred footprints on T203 (plus strand) and the MsvRred protection site on T264 (plus strand). The black trace corresponds to reaction mixtures containing only DNA, whereas the red trace corresponds to reaction mixtures containing DNA and MsvR. MsvR protected regions are boxed using the same scheme as for T203 in panel A, and the asterisks depict the hypersensitive sites. The protected region on T264 is boxed in blue. (C) Diagram of MsvR protected regions on fragments containing the mutations identified in Fig. 3C. The diagram is aligned to the chromatograms in panel B. The gray boxes represent the regions protected from DNase I digestion when MsvR is bound to the indicated template. The orange box represents the position of the overlap for templates T1349 and T1350. The red boxes represent binding boxes 1, 2, and 3, and the green box represents the PfpaA TATA box.

