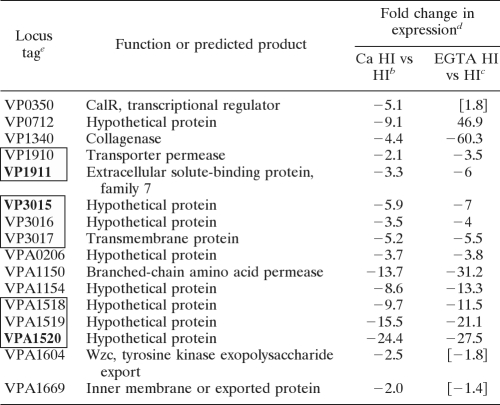
TABLE 4.
Genes repressed by calciuma
Inclusion in this list was determined by a change in expression of 2-fold or greater, with an FDR of ≤0.03, during growth on HI with 4 mM CaCl2 versus growth on HI.
b Fold change in gene expression when the wild type was grown on HI with 4 mM CaCl2 versus on HI alone.
c Fold change in gene expression when the wild type was grown on HI with 4 mM EGTA versus on HI alone.
d A bracketed number indicates that the fold change or the FDR value did not meet the criteria.
e Boxes indicate putative operons, with the promoter-proximal gene in bold.

