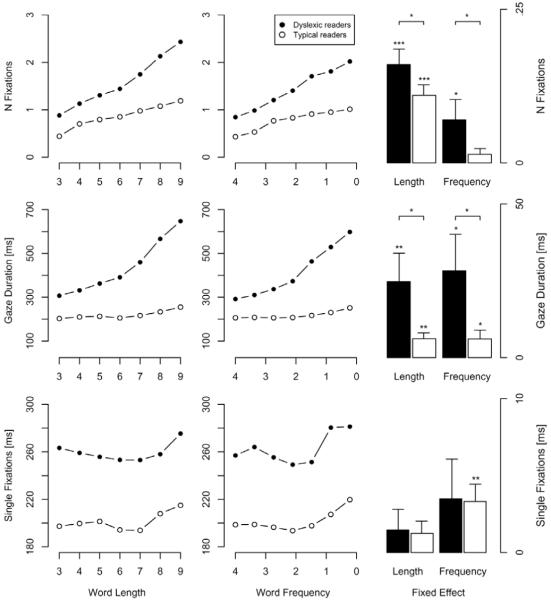
Fig. 2.
The upper section shows how mean number of fixations and gaze durations related to word length and frequency. The lower section shows how word length and frequency affected the fixation duration of singly fixated words. The bar charts represents the linear fixed effects (and 1 standard error) of length and frequency on number of fixations, gaze duration and single fixation duration. Stars above the bars indicate the significance of the fixed effects and stars above brackets indicate the significance of the group differences with *p < .05, **p < .01, and ***p < .001.

