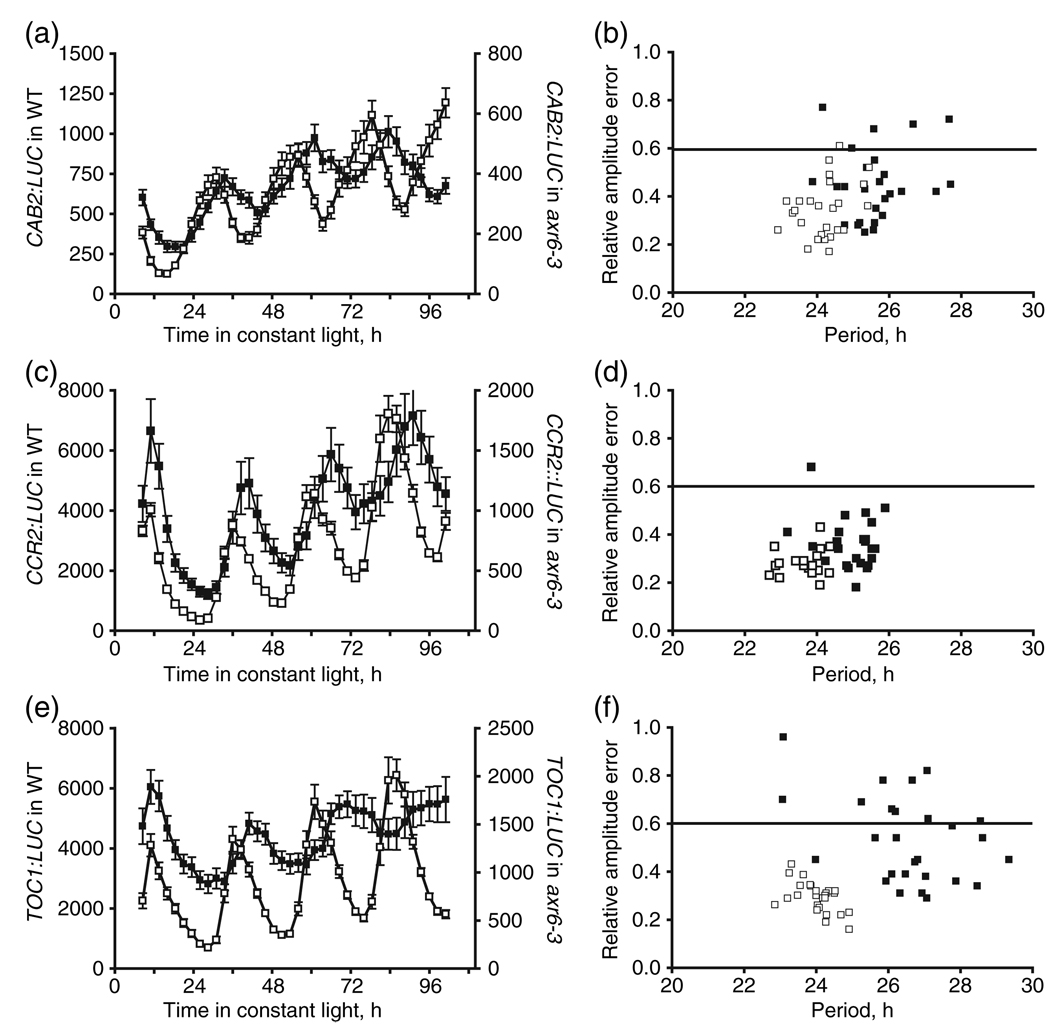
Figure 2. Circadian gene expression in axr6-3 is long-period and rhythms lack the precision of those in WT.
(a, c, e) Bioluminescence rhythms for CAB2:LUC (a), CCR2:LUC (c), and TOC1:LUC (e) in axr6-3 (filled squares) and WT (open squares) seedlings at 22°C. The left y axis shows the bioluminescence signal for WT and the right y-axis shows that for axr6-3. Data are mean values (n = 15 for axr6-3 and n = 10 for WT), and error bars indicate SEM. Representative data in (a), (c), and (e) are from one of two independent experiments.
(b, d, f) Relative amplitude error versus estimated free-running period for CAB2:LUC (b), CCR2:LUC (d), and TOC1:LUC (f) for axr6-3 (filled squares) and WT (open squares) seedlings as determined by FFT/NLLS analysis. Relative amplitude error values ≤0.6 were considered rhythmic, and this cut-off is indicated by the horizontal line. Data in (b), (d), and (f) are from two independent experiments.

