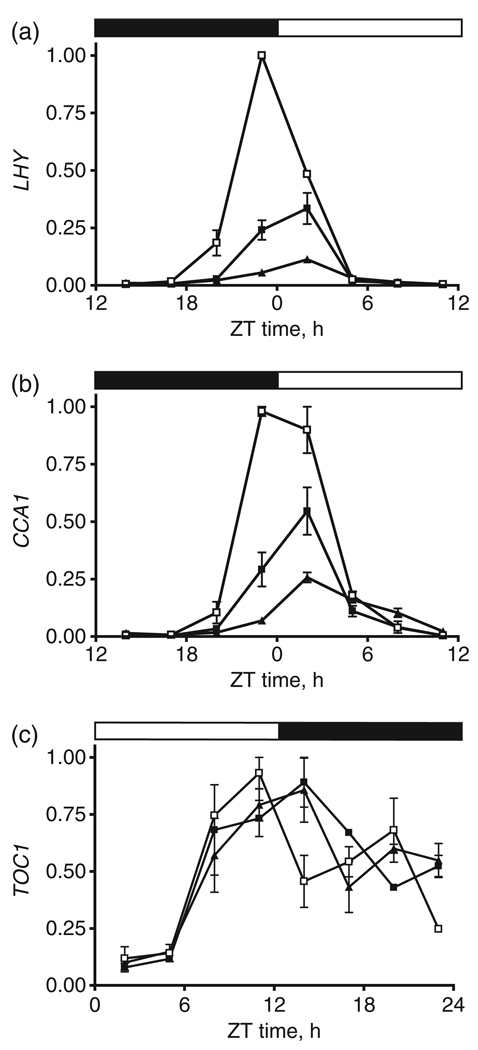
Figure 3. Clock gene expression in axr6-3 is comparable to that of ztl-4.
LHY(a), CCA1(b), and TOC1(c) transcript abundance in 1-week-old seedlings of WT (open squares), axr6-3 (filled squares), and ztl-4 (filled triangles), each grown under diurnal conditions. The black and white bars above the graphs indicate periods of dark and light, respectively. Data are the means of two independent replicates and error bars indicate range. Gene expression was determined by real-time PCR, and expression of IPP2 (see Experimental procedures) was used as a normalization control. The expression level for each experimental gene was calculated using the formula 2[CT(IPP2)–CT(experimental)] where CT is the average threshold cycle for three technical replicates. The expression value for each gene was normalized to the highest value for each experiment.

