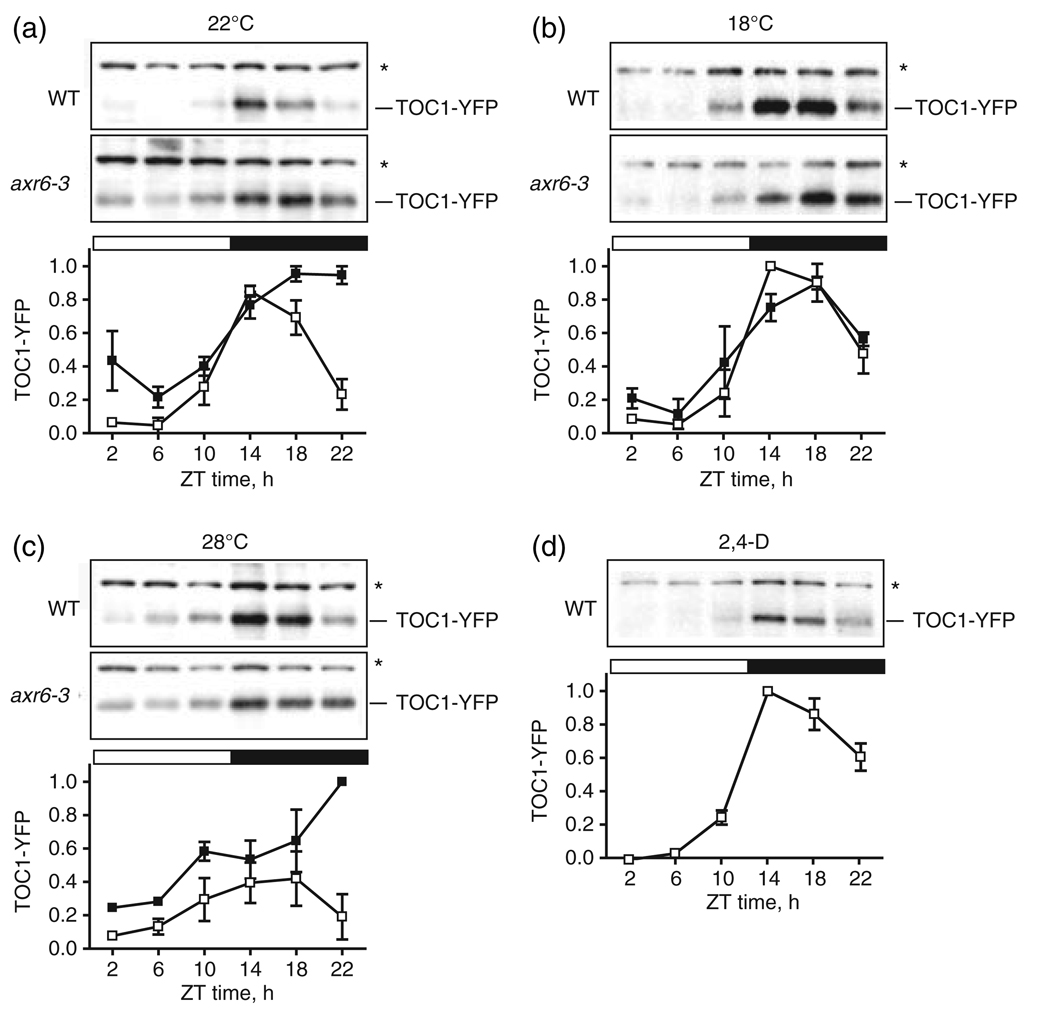
Figure 4. TOC1 turnover is altered in axr6-3, consistent with changes in SCFZTL activity.
(a–c) Normalized TOC1–YFP levels in WT and axr6-3 TOC1:TOC1–YFP mini-gene seedlings grown under 12 h light:12 h dark conditions at 22°C (a), 18°C (b) or shifted from 22 to 28°C (c). (d) WT TMG seedlings grown at 22°C were sprayed at ZT0 with 0.3 µm 2,4-D. Samples were taken at the indicated ZT times.
Upper panels, representative Western blots probed with anti-GFP. Lower panel, normalized average levels of TOC1-YFP in axr6-3 (filled squares) and WT (open squares) from two independent replicates. Error bars represent the range. Asterisks indicate the nonspecific band used as a loading control and for normalization of TOC1-YFP levels. TOC1-YFP levels represent the ratio of the TOC1-YFP band intensity to that of the loading control. The TOC1-YFP level was then normalized to the highest value for each experiment.

