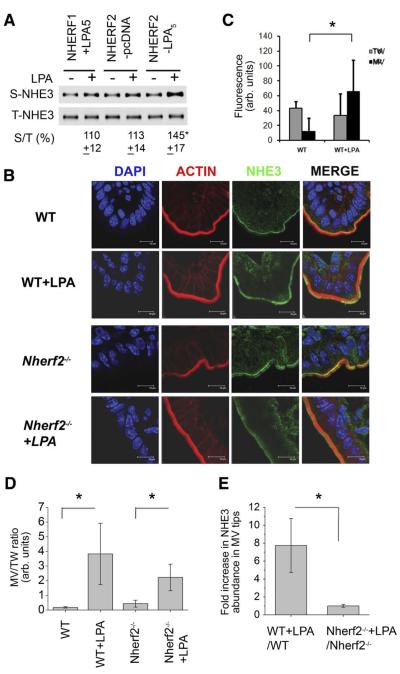
Figure 8.
LPA induced NHE3 trafficking within the brush border membrane (BBM) of wild-type (WT) and Nherf2−/− mice. (A) PS120NHE3 derivatives were treated with LPA, and the amount of NHE3V protein in the plasma membrane was determined by surface biotinylation. The amount of surface NHE3 (S-NHE3) was normalized to total NHE3 (T-NHE3). n = 4. *P <.01 compare with control treatment. (B) Immunofluorescence labels of NHE3 (green), F-actin (red), and nuclei (blue) in the ileum of WT and Nherf2−/− mice are shown. (C) NHE3 fluorescence intensity in the respective 1 μM microvillar (MV) and terminal web (TW) zones during control conditions (left panel) and after LPA perfusion in WT mice is shown. Confocal analysis of LPA-induced NHE3 trafficking was performed as described in Supplementary Figure 2. *P < .05. (D) Effects of LPA on the relative NHE3 expression in MV and TW of WT and Nherf2−/− mice are shown. *P < .05; **P < .01. (E)A much higher “LPA translocation quotient” in WT compared to Nherf2−/− mice is shown. For (C—E), BBMs were analyzed in approximately 10 randomly selected areas of 3 individual sections from each mouse, and 3 pairs of WT and Nherf2−/− mice were analyzed. *P <.05.

