FIG. 3.

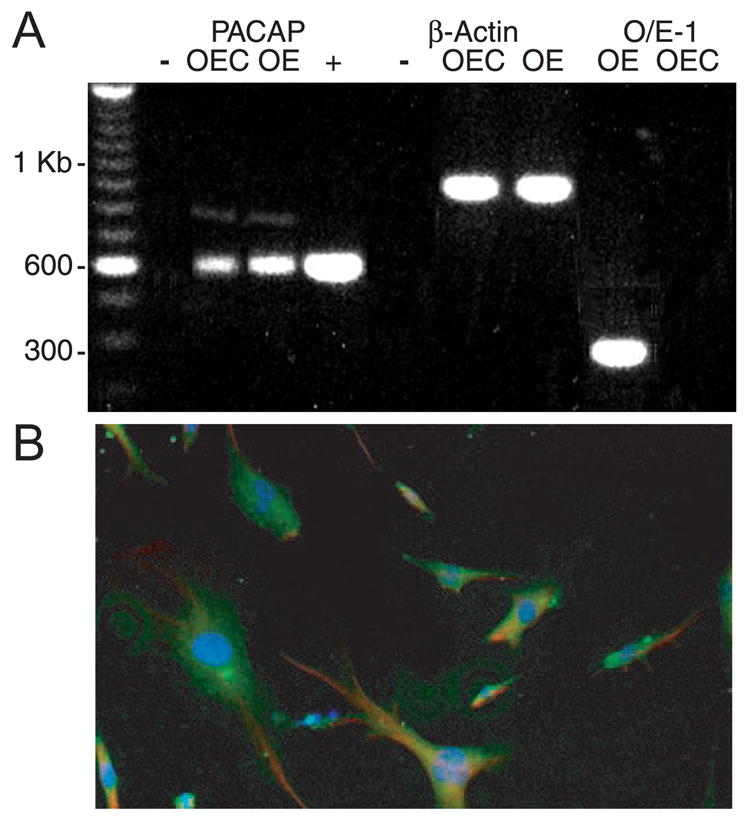
Cultured olfactory ensheathing cells express PACAP. A: reverse transcriptase-polymerase chain reaction (RT-PCR) analysis of PACAP mRNA expression in OEC cultures and adult OEs. The 600-bp product represents the presence of PACAP in both OECs and OEs. Control β-actin and olfactory specific transcription factor Olf-1 (O/E-1) RT-PCR reactions are shown. + indicates PACAP cDNA positive control; − indicates treatment with RNAse. B: olfactory ensheathing glia isolated from postnatal day 5 mice were cultured for 12 days and immunostained with mouse anti-S100β (1:500) and rabbit anti-PACAP38 (1:250). PACAP was visualized with Alexa 488 goat anti-rabbit IgG (green), and S100β was visualized with Alexa 594 goat anti-mouse IgG (red). Nuclei were stained with 4′,6-diamidino-2-phenylindole (DAPI, 1:10,000; blue). Scale bar, 50 μm. Note that all OECs in vitro express S-100β (Franceschini and Barnett 1996).
